Validation of a Visual Prostate Symptom Score in Men With Lower Urinary Tract Symptoms in a Health Safety Net Hospital (PDF)
Urology. August ; 86(2): 354–358. doi:10.1016/j.urology.2015.05.012.
Objective: To evaluate the correlation between the International Prostate Symptom Score (IPSS) and the Visual Prostate Symptom Score (VPSS), a visual assessment of urinary stream, frequency, nocturia, and quality of life using pictograms, in a health safety net population.
Methods: Men presenting to San Francisco General Hospital with lower urinary tract symptoms completed the IPSS and the VPSS without and then with assistance. Statistical analysis was performed using the chi-square test, the Wilcoxon signed rank test, and the Spearman rank correlation.
Results: One hundred twenty-one patients were enrolled between December 2013 and May 2014 with a mean age of 54 years. There were statistically significant correlations between total VPSS and total IPSS (ρ = 0.71; P <.001) and for frequency (ρ = 0.47; P <.001), nocturia (ρ = 0.69; P <.001), force of stream (ρ = 0.65; P <.001), and quality of life (ρ = 0.69; P <.001). In addition, there were statistically significant correlations between total VPSS and both VPSS quality of life (ρ = 0.69; P <.001) and Qmax (ρ = −0.473; P = .006). The mean absolute disagreement for participants who took the IPSS independently vs with assistance was greater than for those who took the VPSS independently vs assistance for all symptoms: frequency (0.64 vs 0.3, respectively; P <.001), weak stream (0.82 vs 0.14, respectively; P <.001), nocturia (0.38 vs 0.23, respectively; P = .023), and quality of life (0.63 vs 0.32, respectively; P = .005).
Conclusion: Many men altered their IPSS responses when they received assistance. There was significantly less alteration in responses using the VPSS, suggesting that the VPSS is useful in determining lower urinary tract symptoms, particularly in patients with limited education and literacy.
Figures
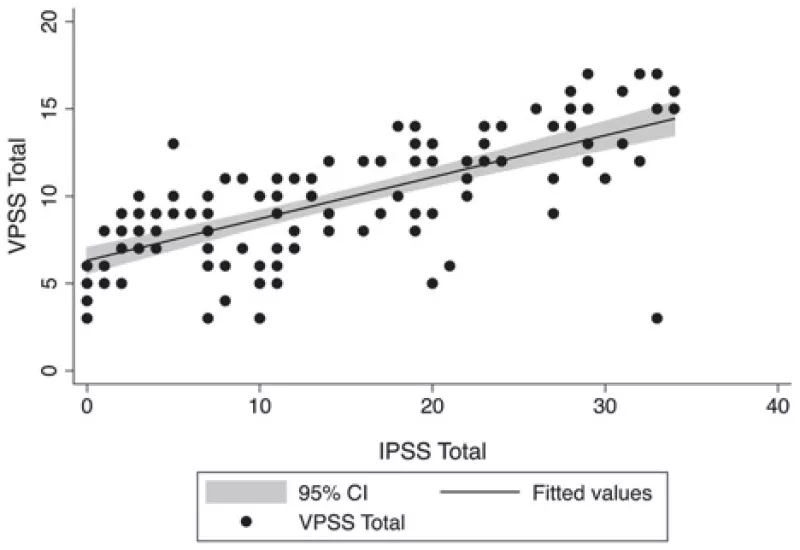
Figure 1. Correlation between total VPSS and total IPSS (r = +0.708; P <.001). CI, confidence interval; IPSS, International Prostate Symptom Score; VPSS, Visual Prostate Symptom Score.
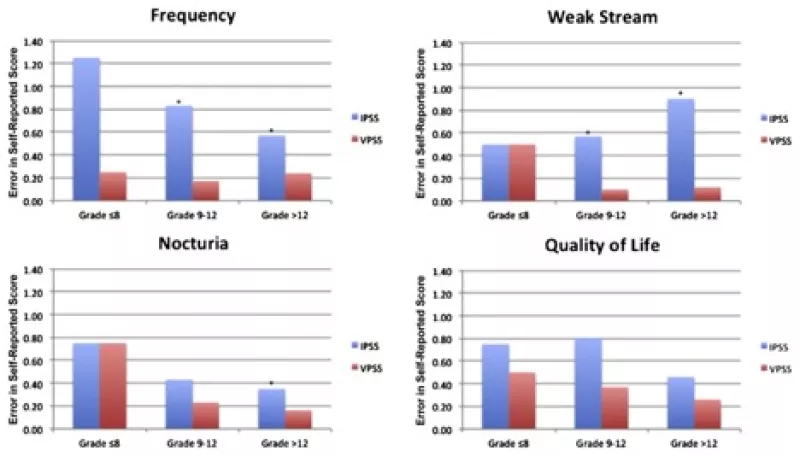
Figure 2. Mean absolute disagreement between self-administered and assisted scores for each symptom by education level. Statistical significance (P <.05) between errors in IPSS and VPSS by grade category indicated by *. IPSS, International Prostate Symptom Score; VPSS, Visual Prostate Symptom Score. (Color version available online.)