Playground Equipment-related Genital Injuries in Children: An Analysis of United States Emergency Departments Visits, 2010-2019
Gold Journal
Objective: To evaluate the demographics, epidemiology, and common mechanisms associated with playground equipment-related genital injuries in children.
Methods: We examined the National Electronic Injury Surveillance System database to obtain playground-related genital injuries sustained in children ≤17 years from 2010 to 2019. Demographics of the patients and injury characteristics were analyzed using sample weights to produce national estimates.
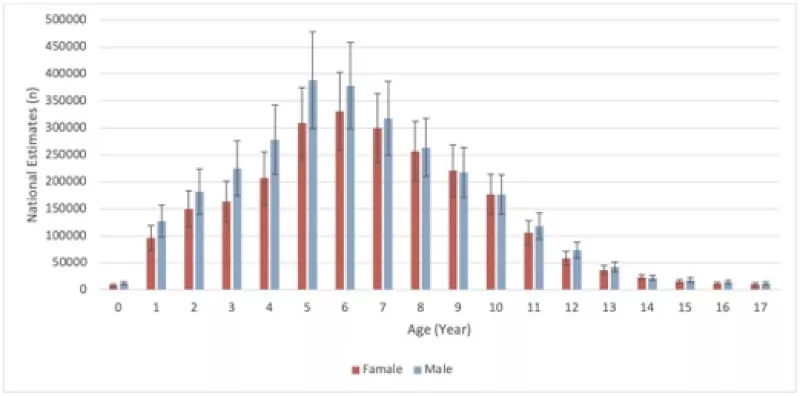
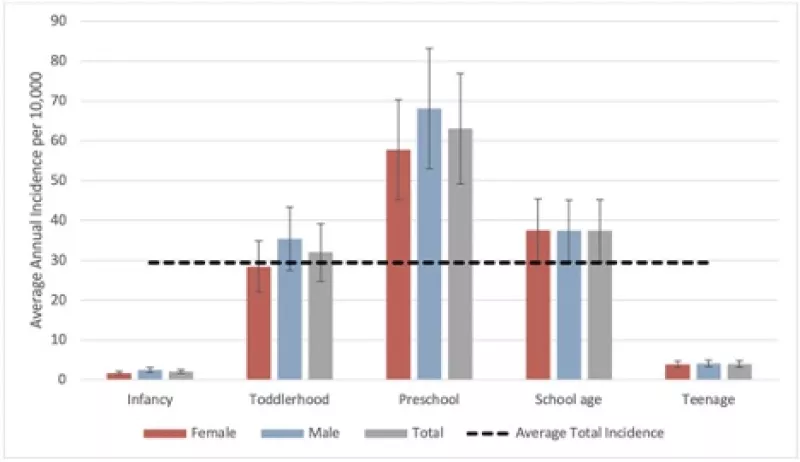
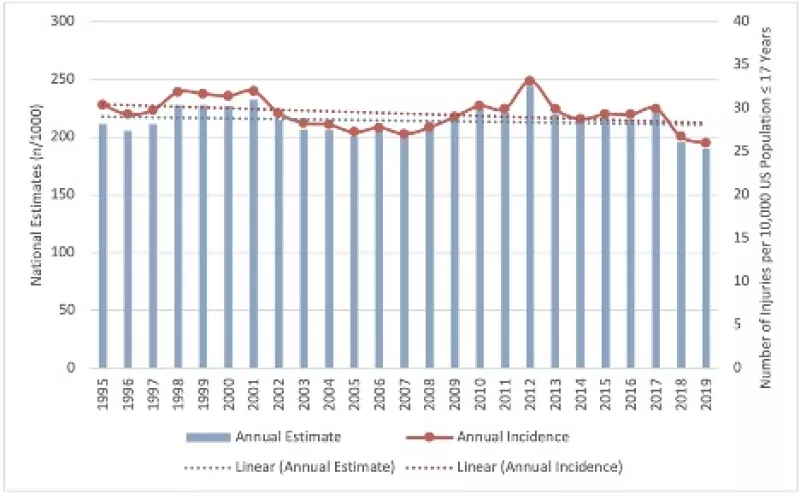
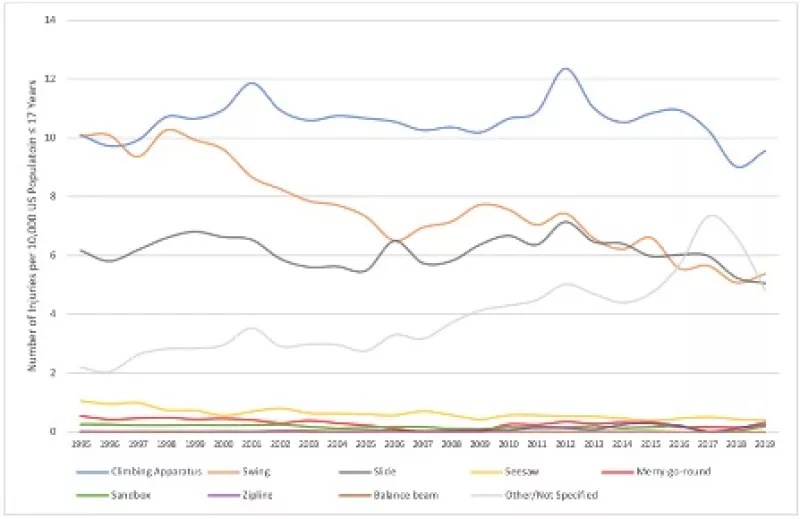
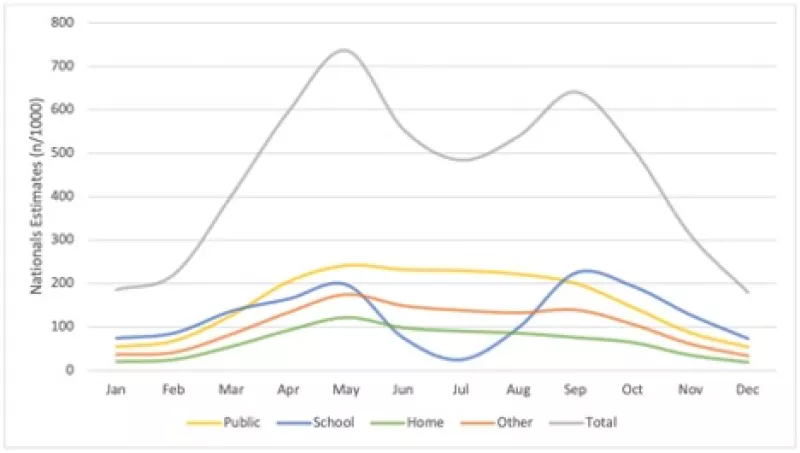
Results: During the study period, an estimated 27,738 (95% confidence interval 18,602-36,874) emergency department visits with an average annual incidence of 3.8 (95% confidence interval 2.5-5) per 100,000 United States population ≤17 years were reported. The mean age was 6.6 (standard error 0.152) years with most injuries occurring in pre-school children (48.1%) and females (81.1%). Over ½ of genital injuries (55.2%) were associated with climbing apparatus. This was followed by slides (10.7%), swings (9%), and seesaws (4.8%). Most genital injuries occurred at public (41.4%) and school settings (36.3%). Straddling and/or falling was the most common mechanism leading to genital injuries (84.4%). The incidence of injuries remained constant during the 10-year study period (change = + 2.6%; r2 = 0.121, P = .326). Monthly variations in the number of injuries existed with peak injuries in April-May, and September-October.
Conclusion: Despite current safety standards, genital injuries arising from playground equipment have remained stable since 2010. By defining common devices, mechanisms, and conditions associated with genital injuries, this study may help guide efforts aimed at the prevention of such injuries in various locations.